> ## Documentation Index
> Fetch the complete documentation index at: https://hoopdev-fix-add-missing-mechanic-for-session-download-button.mintlify.site/llms.txt
> Use this file to discover all available pages before exploring further.
# Monitoring Sessions
> Learn how to track and audit connection usage through the Sessions interface
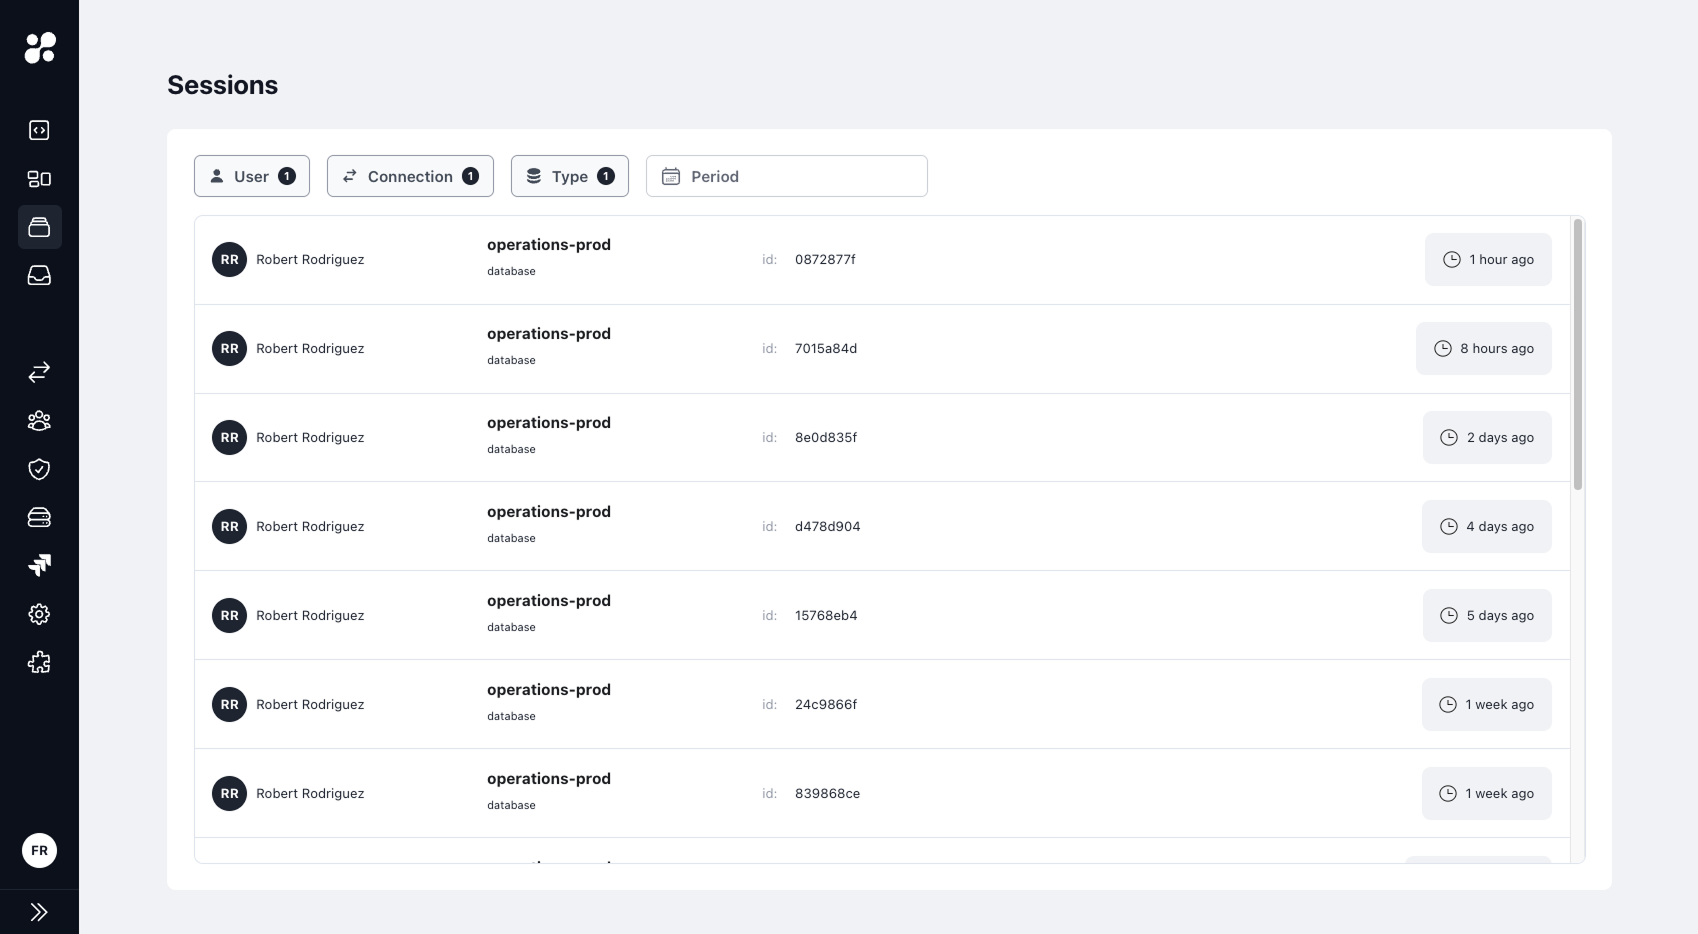 The Sessions interface provides a comprehensive view of all connection activities across your organization. You can monitor active sessions, review past activities, and investigate specific actions taken by users.
## Sessions Overview
The Sessions page displays a list of all connection activities with key information:
* User who initiated the session
* Connection name and type
* Session ID for reference
* Timestamp and duration
* Status indicators
### Filtering and Search
Use the top filters to narrow down sessions:
* **User**: Filter by specific team members
* **Connection**: View sessions for particular connections
* **Type**: Filter by connection type (database, application, etc.)
* **Period**: Select a specific time range
## Session Details
The Sessions interface provides a comprehensive view of all connection activities across your organization. You can monitor active sessions, review past activities, and investigate specific actions taken by users.
## Sessions Overview
The Sessions page displays a list of all connection activities with key information:
* User who initiated the session
* Connection name and type
* Session ID for reference
* Timestamp and duration
* Status indicators
### Filtering and Search
Use the top filters to narrow down sessions:
* **User**: Filter by specific team members
* **Connection**: View sessions for particular connections
* **Type**: Filter by connection type (database, application, etc.)
* **Period**: Select a specific time range
## Session Details
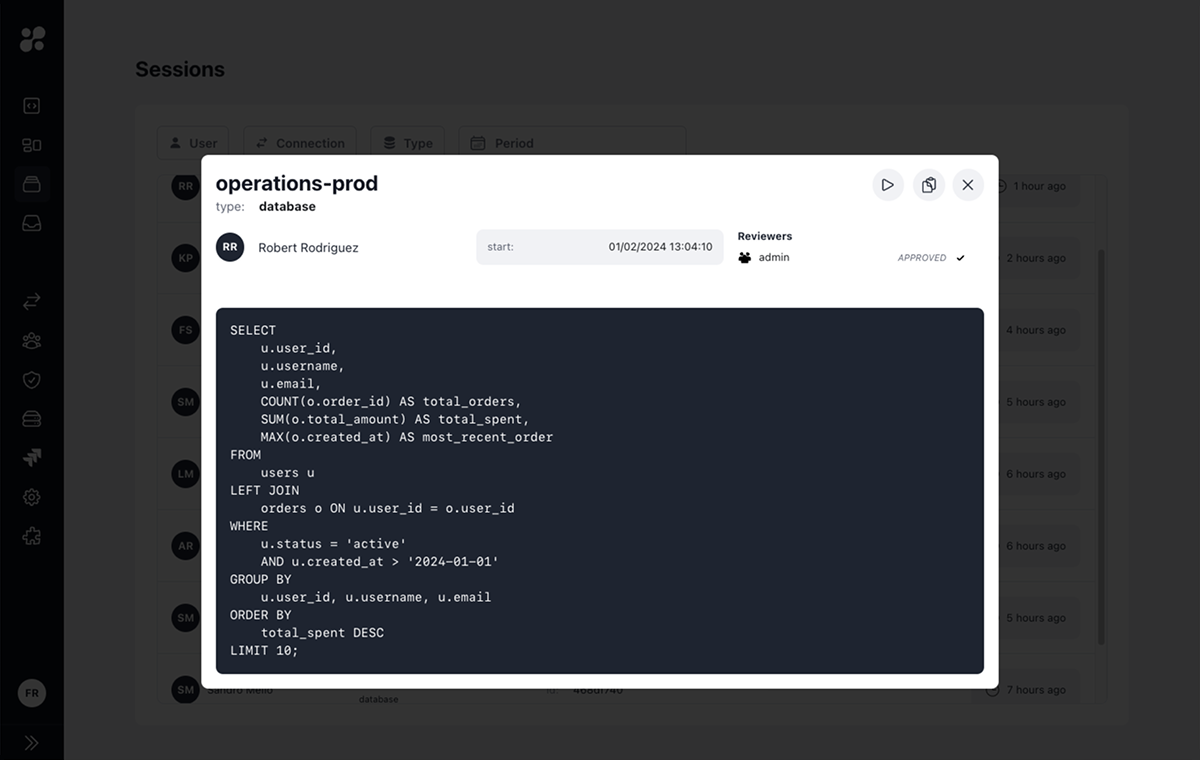 Clicking on a session opens a detailed view that shows:
### Connection Information
* Session start and end times
* Connection type and name
* User who initiated the session
### Activity Log
For database connections:
* SQL queries executed
* Query results
* Execution timestamps
For application and SSH connections:
* Commands executed
* Command output
* Terminal sessions
## Handling Large Results
When an operation returns a value too large for a browser to handle, it can cause the session to crash or freeze. To prevent this, we automatically truncate the preview and provide the full data via a downloadable file.
**Important Note on Configuration**: If your organization has the "Block Downloads" setting enabled (typically for security reasons), you may run into a situation where:
* The data is too large to display in-browser
* The download option is unavailable
**Why not just show it in the browser?** We prioritize your uptime. If we forced the browser to render these massive values without truncation, it would likely crash your current session, making the product unusable until the session is cleared.
The "Block Downloads" setting is controlled by the `DISABLE_SESSIONS_DOWNLOAD` environment variable. See [Environment Variables](/setup/configuration/env-vars) for configuration details.
## Session Actions
From the session details view, you can:
* Re-run a query to verify results or troubleshoot issues
* Copy session ID for reference
* Download session logs
* Share session details with reviewers
## Integration with Reviews
Sessions may require approval before starting if JIT reviews are enabled for the connection
Individual commands or queries may need approval during the session
## Best Practices
Periodically review session logs for security and compliance
Use session IDs to track specific activities during incident response
Maintain session records for audit requirements
Monitor session patterns to optimize connection usage
## Learn More
Learn about session approval workflows
Understand command-level review processes
Clicking on a session opens a detailed view that shows:
### Connection Information
* Session start and end times
* Connection type and name
* User who initiated the session
### Activity Log
For database connections:
* SQL queries executed
* Query results
* Execution timestamps
For application and SSH connections:
* Commands executed
* Command output
* Terminal sessions
## Handling Large Results
When an operation returns a value too large for a browser to handle, it can cause the session to crash or freeze. To prevent this, we automatically truncate the preview and provide the full data via a downloadable file.
**Important Note on Configuration**: If your organization has the "Block Downloads" setting enabled (typically for security reasons), you may run into a situation where:
* The data is too large to display in-browser
* The download option is unavailable
**Why not just show it in the browser?** We prioritize your uptime. If we forced the browser to render these massive values without truncation, it would likely crash your current session, making the product unusable until the session is cleared.
The "Block Downloads" setting is controlled by the `DISABLE_SESSIONS_DOWNLOAD` environment variable. See [Environment Variables](/setup/configuration/env-vars) for configuration details.
## Session Actions
From the session details view, you can:
* Re-run a query to verify results or troubleshoot issues
* Copy session ID for reference
* Download session logs
* Share session details with reviewers
## Integration with Reviews
Sessions may require approval before starting if JIT reviews are enabled for the connection
Individual commands or queries may need approval during the session
## Best Practices
Periodically review session logs for security and compliance
Use session IDs to track specific activities during incident response
Maintain session records for audit requirements
Monitor session patterns to optimize connection usage
## Learn More
Learn about session approval workflows
Understand command-level review processes